
The HumanAI and OrgAI Calculator: a guided tour
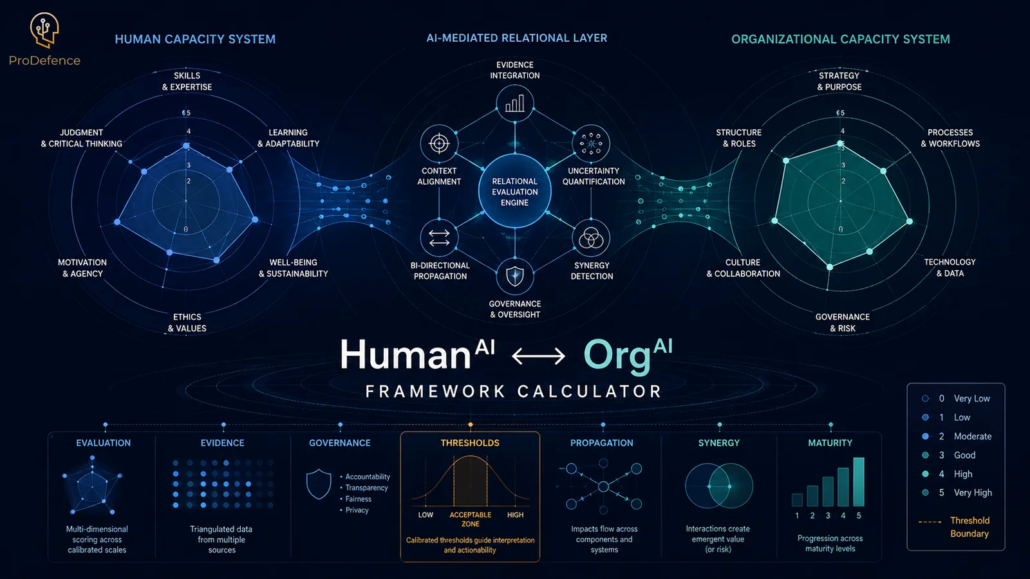
Every screenshot is real, produced by running the instrument. The data in them is the illustrative example the calculator opens with, not any client’s data. The interface is in English.
What it is, in two sentences
The calculator is the digital instrument that accompanies the whitepaper “HumanAI and OrgAI: A Relational Framework for AI-Mediated Human and Organizational Capacity”. It turns the relationships defined there into an assessment record you complete for a concrete situation, one process, one team, one observation period, and which someone else can then verify, challenge and repeat.
A single HTML file. No installation, no account, no server, and no network request of any kind.
What it looks like when you open it
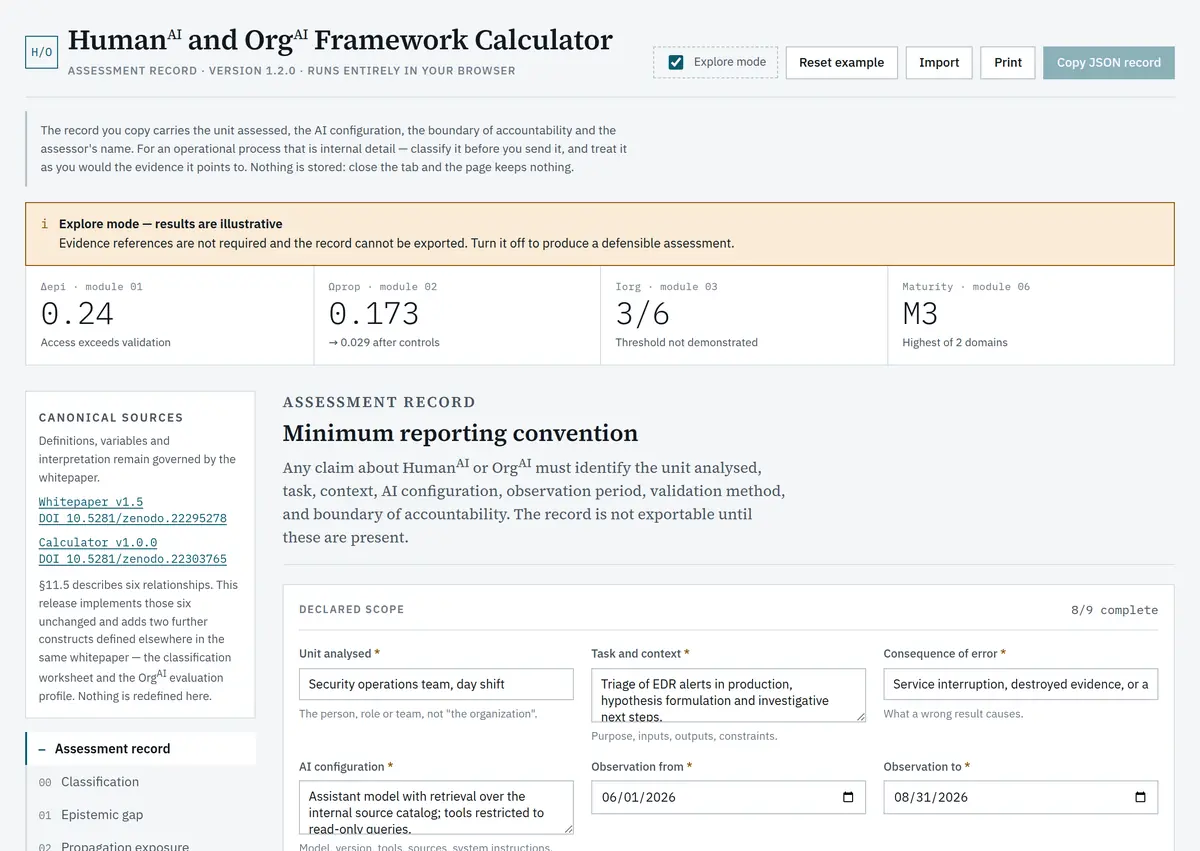
It opens with a worked example, the illustrative case from the whitepaper, so you can see immediately how it behaves rather than facing an empty form. The “Reset example” button brings it back at any time.
Three zones, from top to bottom:
- The action bar: the switch between working modes, resetting the example, importing a record, printing and copying the record.
- The results strip: the four figures that summarise the assessment, the epistemic gap, propagation exposure, the organisational threshold and maturity. They stay visible whichever module is open.
- The workspace: module navigation on the left, the active module on the right.
Navigation: eight modules and a diagnostic
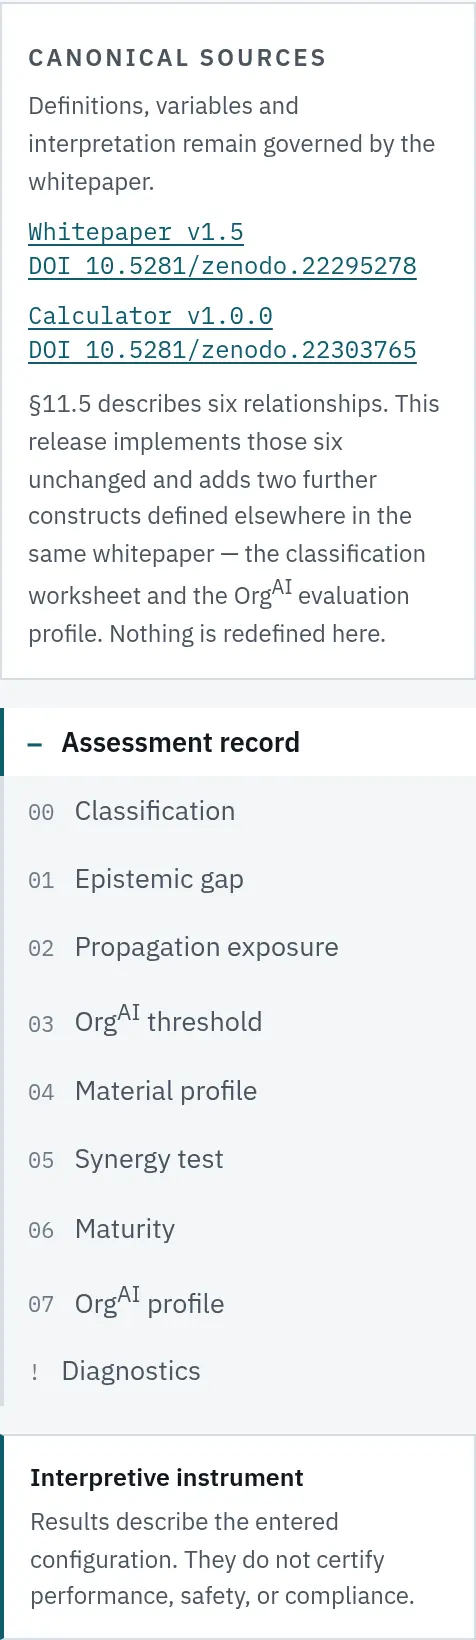
The modules are a sequence rather than a menu. Module 02 consumes the result of 01. Module 06 depends on 03. The classification worksheet, module 00, can stop everything else if the situation is not a HumanAI case.
The orange dots next to modules are a status signal: an incomplete record, conditions declared without evidence, a single dimension marked relevant, active diagnostic flags. You do not have to enter every module to find out where you still owe something.
At the bottom sit the canonical sources with the DOIs of the whitepaper and of the instrument, plus the note explaining the relationship between the current version and section 11.5 of the whitepaper.
Two working modes
The distinction between exploring and assessing is explicit, because mixing the two is the usual way results are produced that look like an assessment without being one.

In exploration mode you can move every value freely to see how the relationships behave. Evidence references are not required, and the record cannot be exported. Someone who only wants to understand the formula is not forced to complete a full record; in exchange, they cannot accidentally produce an artefact that looks like an assessment.

Clear the checkbox and the instrument becomes demanding.
The record: what must be declared before any number
The whitepaper imposes a minimum reporting convention: any claim about HumanAI or OrgAI must identify the unit analysed, the task, the context, the AI configuration, the observation period, the validation method and the limit of responsibility. The instrument turns that into an operating condition.
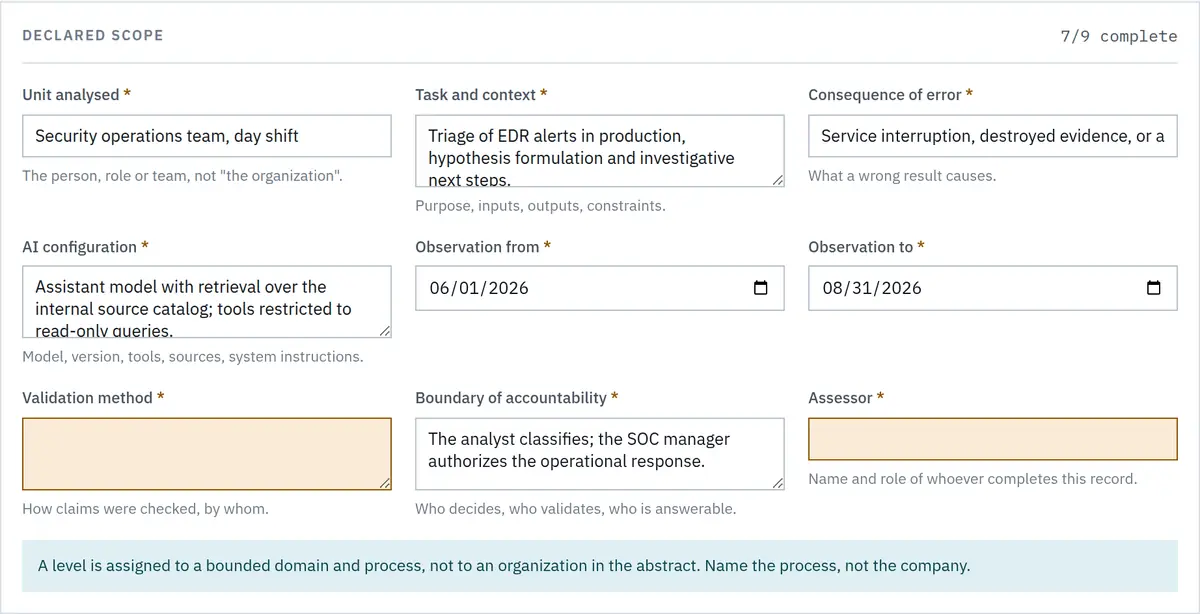

For as long as something is missing, export stays blocked and results are marked provisional. The modules keep calculating, so you can work, but you cannot produce a record that claims more than you know.

The record also carries an identifier of its own. If you keep it when reassessing the same unit six months later, the two records form a comparable series instead of being two unrelated assessments.
Module 00: classification, before measurement
The first question is not “how much” but “what are we assessing”. The ten questions of the membership test establish whether the situation is a HumanAI case and whether it meets the conditions for OrgAI.
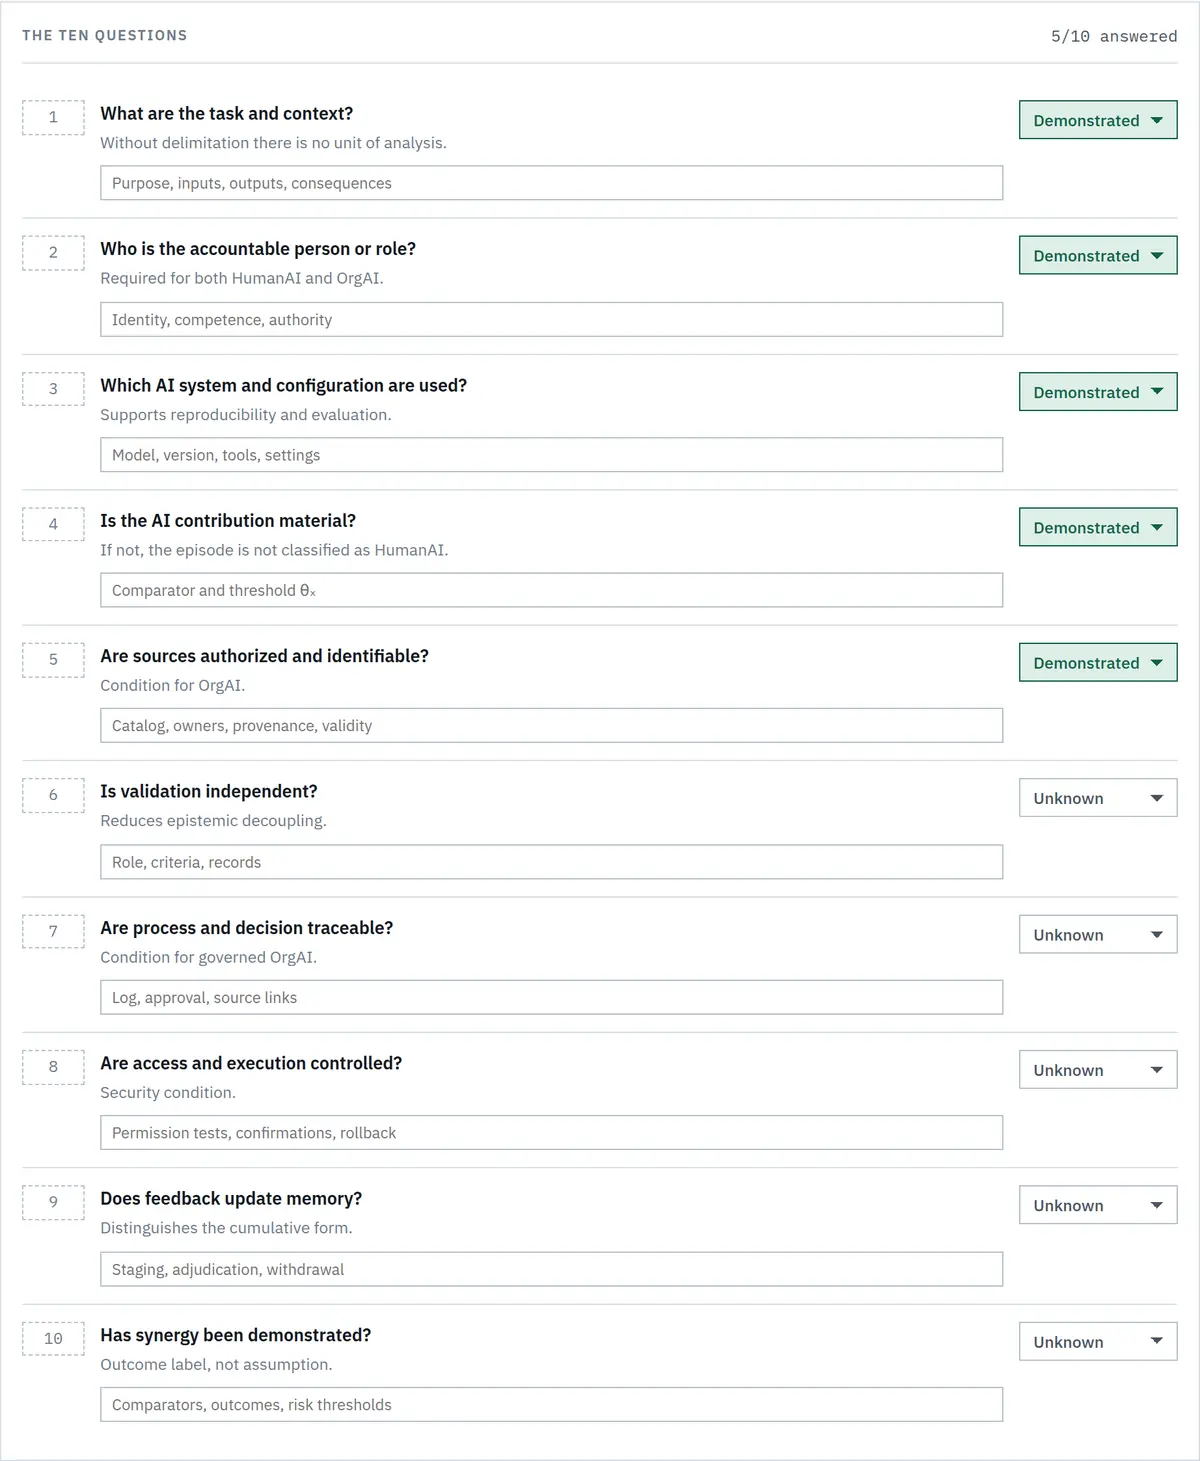
Each question has three possible states, demonstrated, not satisfied and unknown, and a field in which you write the evidence, with a suggested example in place of the text (“catalogue, owners, provenance, validity”). The unknown state never counts as demonstrated.
One question alone stops the record: if you declare that the AI contribution is not material, the case is not HumanAI for that episode and the measurement modules no longer apply. Beneath the questions sits the list of cases the whitepaper excludes: an ignored suggestion, an automation with no AI component, several licences used independently.
Module 01: the gap between access and validation
This is where the central idea of the framework sits. You enter three numbers: how many tasks are in the declared set, for how many AI produced a usable answer, and for how many the accountable person could produce a verified justification.
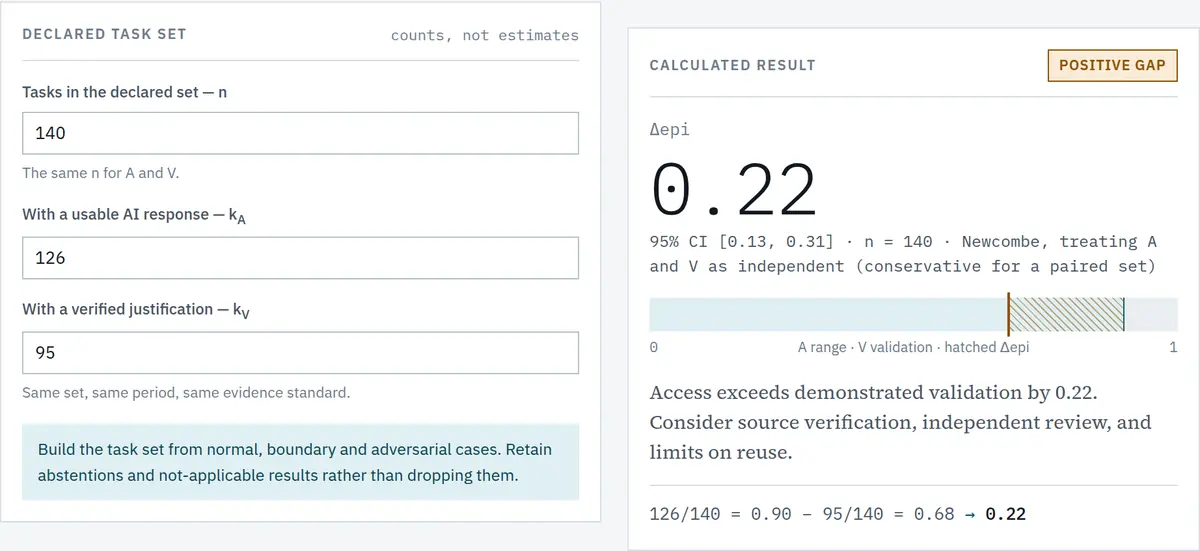
You enter counts, not estimated percentages. The reason is disciplinary: “about 90%” cannot be verified, “126 out of 140” can. And only counts allow the confidence of the result to be computed.
Compare the two screenshots. In the first, 0.22 over 140 tasks, with an interval of [0.13 – 0.31], gap demonstrated. In the second, a larger gap, 0.25, but over 12 tasks:
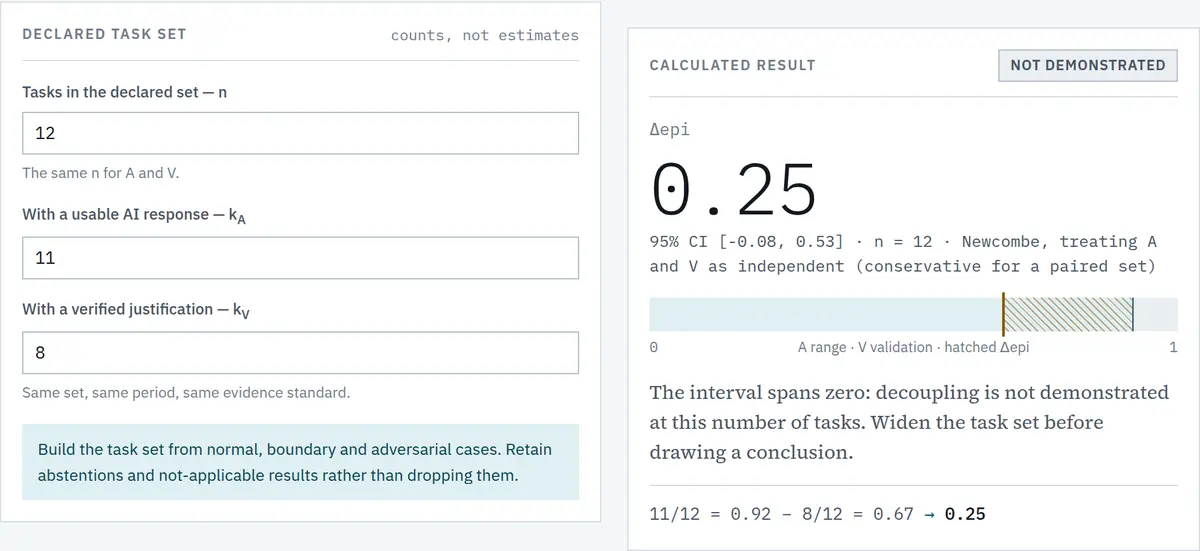
The interval is [-0.08 – 0.53], so it includes zero, and the verdict becomes “Not demonstrated”, not demonstrated at this task volume. A larger gap, poorly measured, supports less than a smaller one measured well. The instrument does not hide that difference behind the same two-decimal number.
The verdict is “not demonstrated”, not “no gap”. The distinction matters: absence of evidence is not evidence of absence, and the instrument’s wording respects that.
Below the result, a positive gap does not end with a number: the module displays the seven mitigation measures from the whitepaper as a selectable list, and what you tick there feeds the next module.
Module 02: what happens to an error in the flow
A gap in an isolated process is a local problem. In a process where the result is reused, it is amplified. The module models that amplification with two factors, the reuse rate and the criticality of the consequence, and computes two states: now, and after the controls you declare.
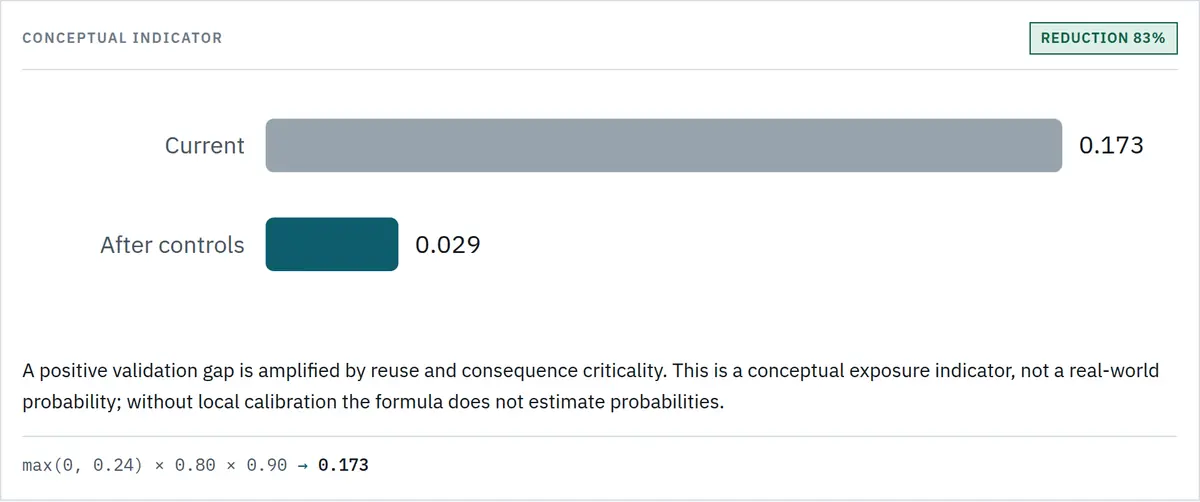
The comparison is the argument, not the value on its own. The instrument shows the reduction as a percentage and flags separately the case in which the target would reduce exposure by cutting access rather than raising validation. Both lower the number, but they are entirely different decisions.
Module 03: the organisational architecture, with evidence
Six constitutive conditions: authorised knowledge, processes, roles and authority, governance, security, traceability. All six, otherwise the threshold is not demonstrated.

Each criterion has three fields instead of a checkbox: the state, an evidence reference and its type. The rule that changes the nature of the instrument is simple: a criterion marked “demonstrated” without an evidence reference appears as declared, undocumented, and the field is highlighted. It does not count towards the threshold.
The counter becomes a pair: “5/6 declared · 4/6 documented”. The second number is the one that counts, and the difference between them shows exactly the distance between what an organisation believes about itself and what it can show.
Below the six, separated by a line, sits the seventh component, validated learning. It is part of the architecture but not of the minimum threshold: it conditions the M5 level only. The distinction belongs to the framework, and the instrument shows it rather than hiding it.
Module 04: the profile, not the score
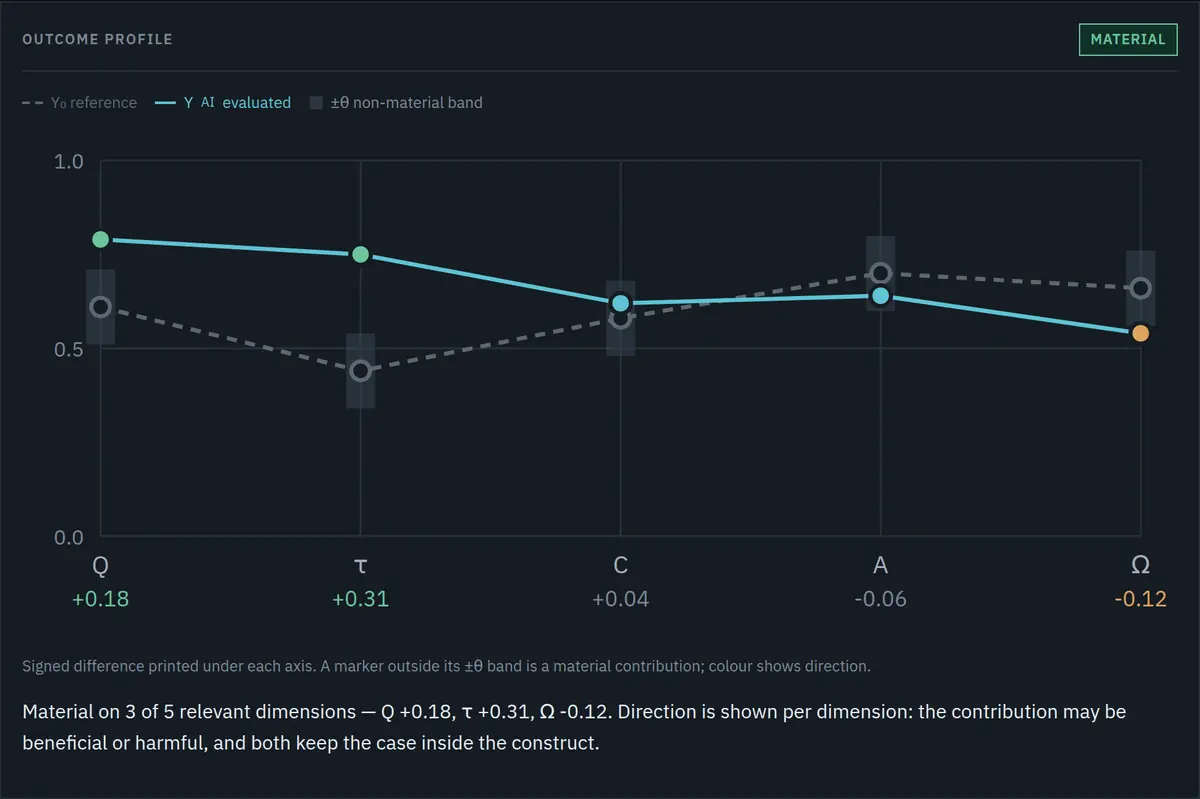
The AI contribution is assessed across seven dimensions at once: quality, time, error, calibration, autonomy, learning and risk exposure. It is material if it exceeds the declared threshold on at least one relevant dimension.
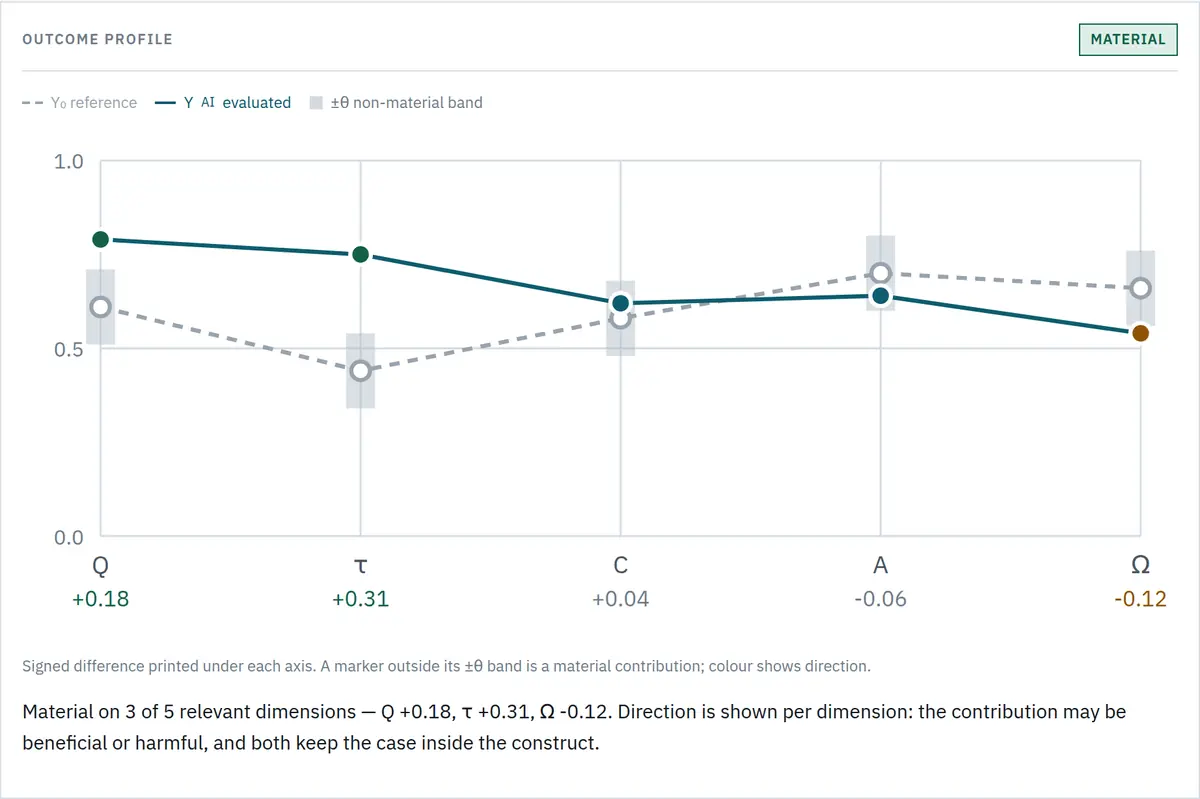
The chart shows what a single score would hide: in the illustrative example, quality and time improve, but autonomy and risk exposure worsen. The verdict is not compressed into a figure, it reads “material on 3 of 5 relevant dimensions”, with the difference and the direction for each.
Data is entered through one card per dimension:
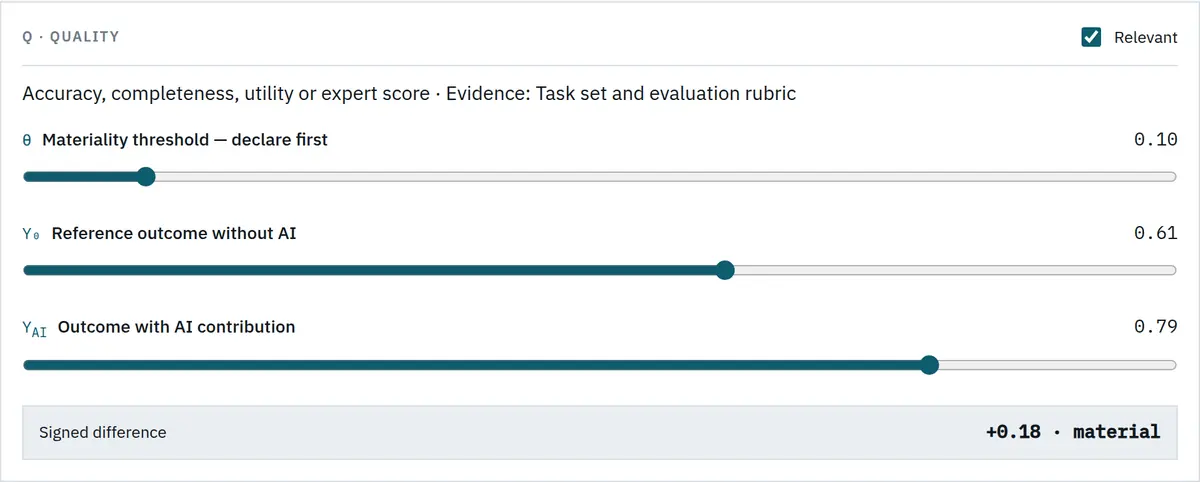
The order of the fields is not accidental: the threshold appears before the two results, because the whitepaper requires it to be declared before the assessment, otherwise classification becomes opportunistic. If you change it after entering the results, the instrument records that in the record.

A dimension that cannot be measured credibly is not filled with zero and not reported as “n/a”. It is left out of the decision, and the card collapses.
Module 05: synergy, with declared thresholds
Synergy is not assumed and is not a maturity level. It is demonstrated: the configuration must exceed every relevant comparator on the same task, and every declared risk threshold must be satisfied.
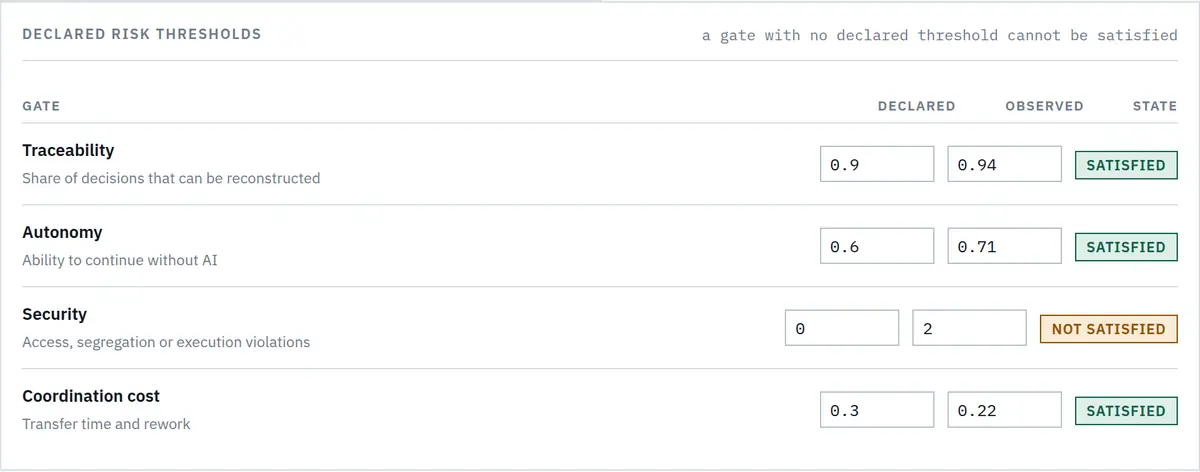
The gates are not checkboxes. Each requires a declared threshold and an observed value, and a gate without a declared threshold stays “undeclared” and blocks synergy just as a failed one does. You cannot demonstrate compliance with a threshold you never set.
The result names the comparator that binds the conclusion explicitly: “margin +0.06 over Human + AI (0.76)”. An anonymous margin would hide the decisive information: beating a person working alone and beating the best existing process are very different claims. The instrument also flags a weak comparator set.
Module 06: maturity, per domain
A level is assigned to a bounded domain and a process, not to an organisation. The whitepaper is explicit: the same company can be at M1 in one domain, M4 in another, and prohibit AI in a third.
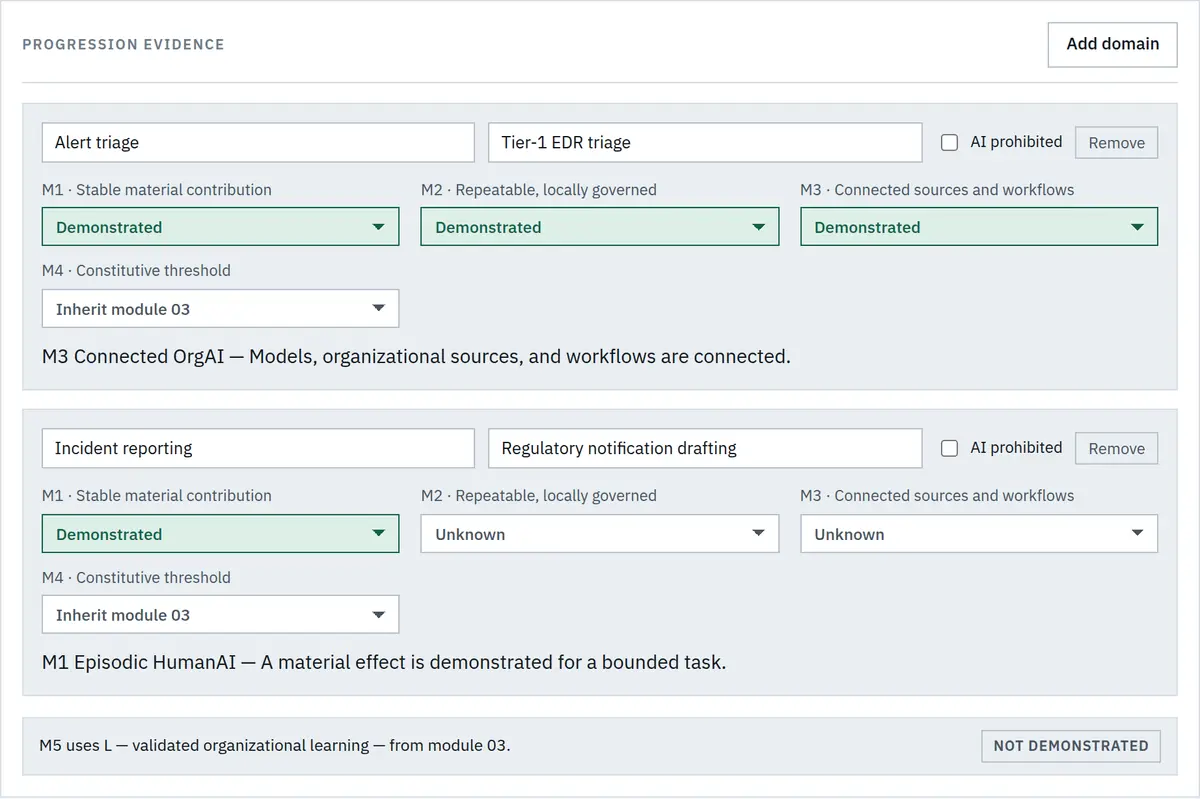
You add as many domains as you need. Each gets its own progression states and can inherit the threshold from module 03 or override it locally. A domain in which AI is prohibited is recorded as such and appears without a level, not as M0, because a governance decision is not a maturity shortfall.
Above it, a compact matrix shows every domain at once. Below it, the M0 to M5 levels with the minimum evidence and the limit of each: for M3, “connectivity does not demonstrate governance”; for M4, “learning may remain manual”; for M5, “adaptation does not demonstrate synergy”.
Module 07: what the architecture produces
The threshold says the architecture exists. This module says what it produces: nine dimensions of organisational assessment, each with its value and its evidence.
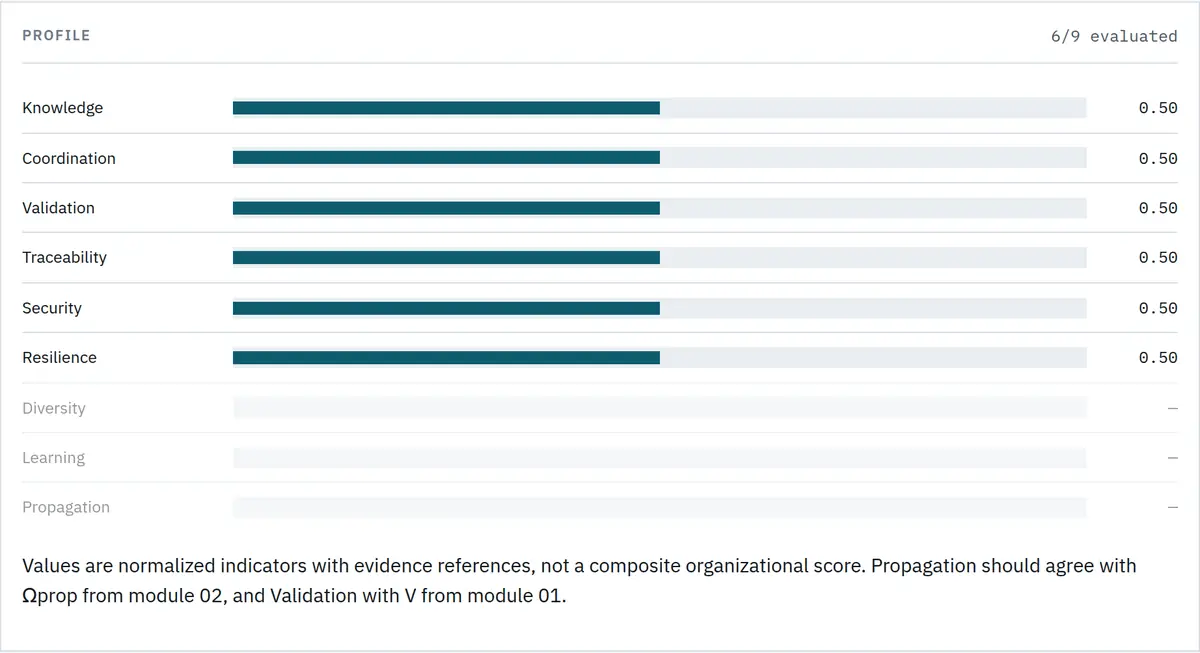
Two dimensions correlate with other modules, propagation with the exposure indicator from module 02, validation with V from module 01, and a large gap between them is itself a finding: it points to verification that is formal only.
The diagnostic
Across every module runs a detector that reads the configuration as a whole and looks for contradictions between what was declared in one place and what was measured in another.
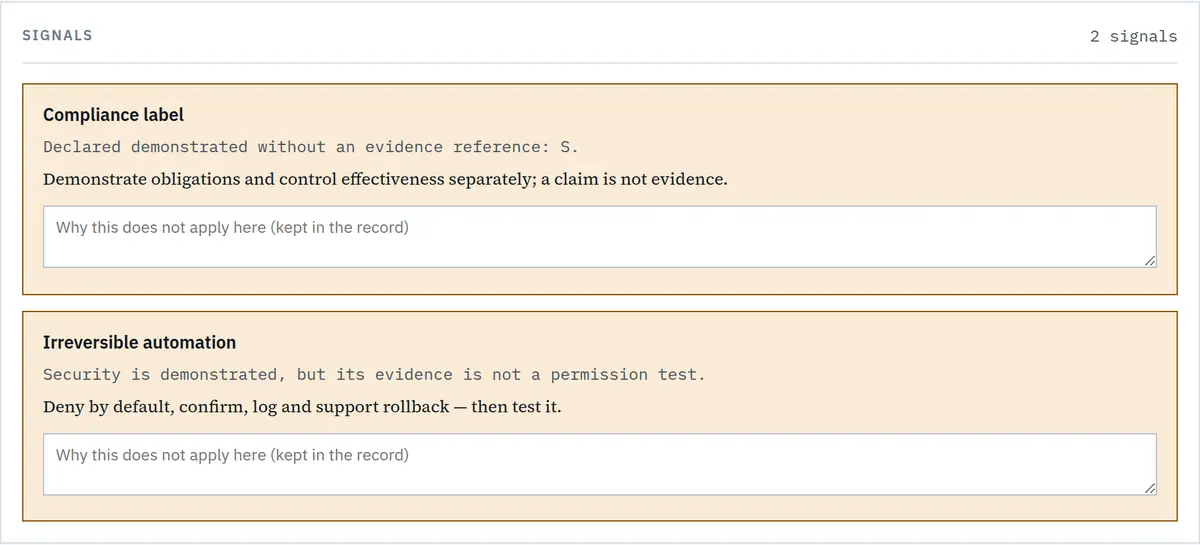
Eight patterns from the whitepaper plus two internal consistency checks. When a flag is raised, it shows what triggered it, with the concrete values from the record, and the correction the framework prescribes. It can be annotated, and the annotation enters the record.
Flags do not change any result and do not add up into a risk indicator: that would reintroduce exactly the anti-pattern the instrument avoids in module 04.
What comes out of the instrument
The record
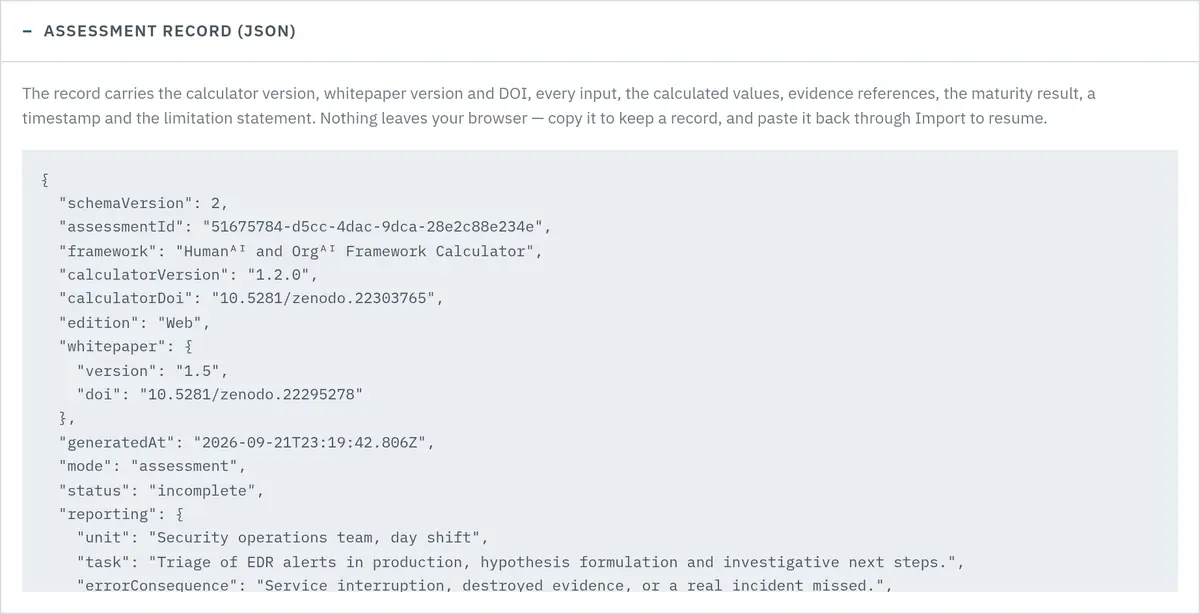
It contains the version of the instrument and of the whitepaper with their DOIs, every input, the computed values, the evidence references, the flags with their annotations, the record identifier, the generation timestamp and the limitation statement. It is copied to the clipboard rather than downloaded, because a page-initiated download does not work in every hosting context, and a button that does nothing is worse than no button.
Import
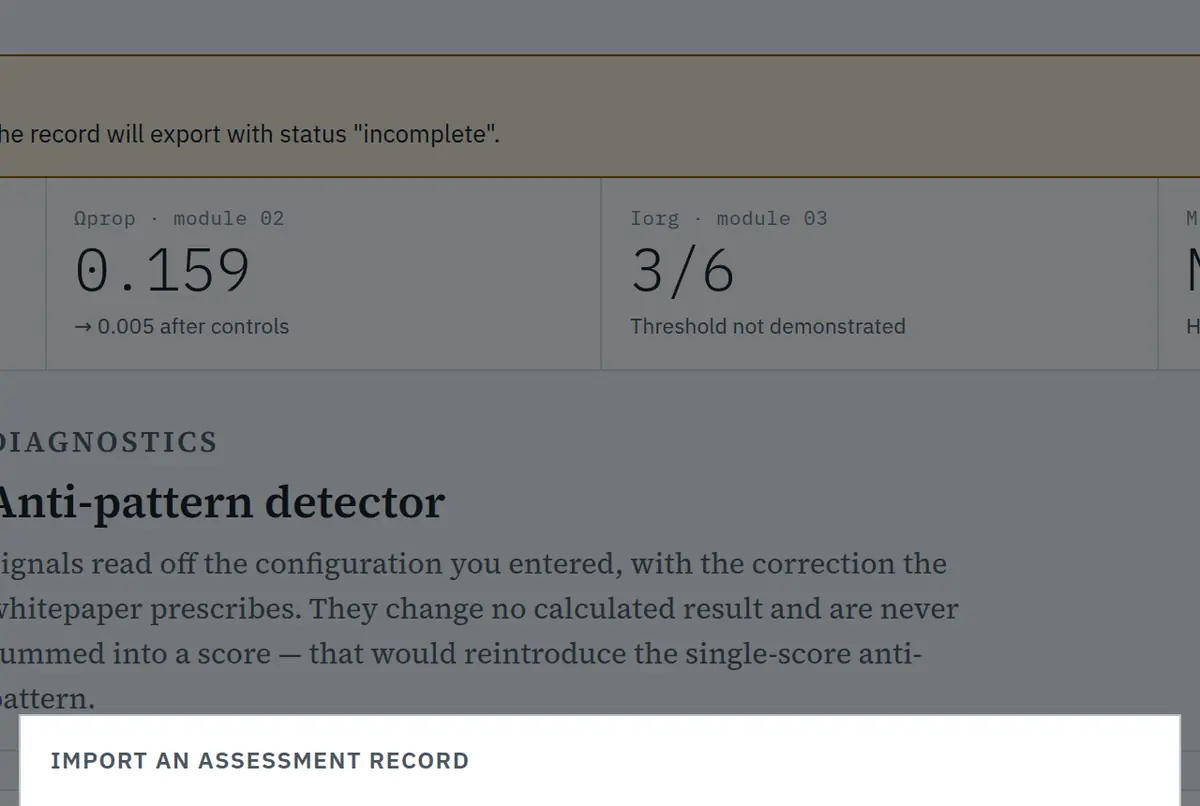
A record can be reloaded. That makes periodic reassessment possible: you reopen the same record six months later, change the period, recount, and compare. Records from earlier versions are migrated, with an explicit note of what could not be recovered.
The printed record
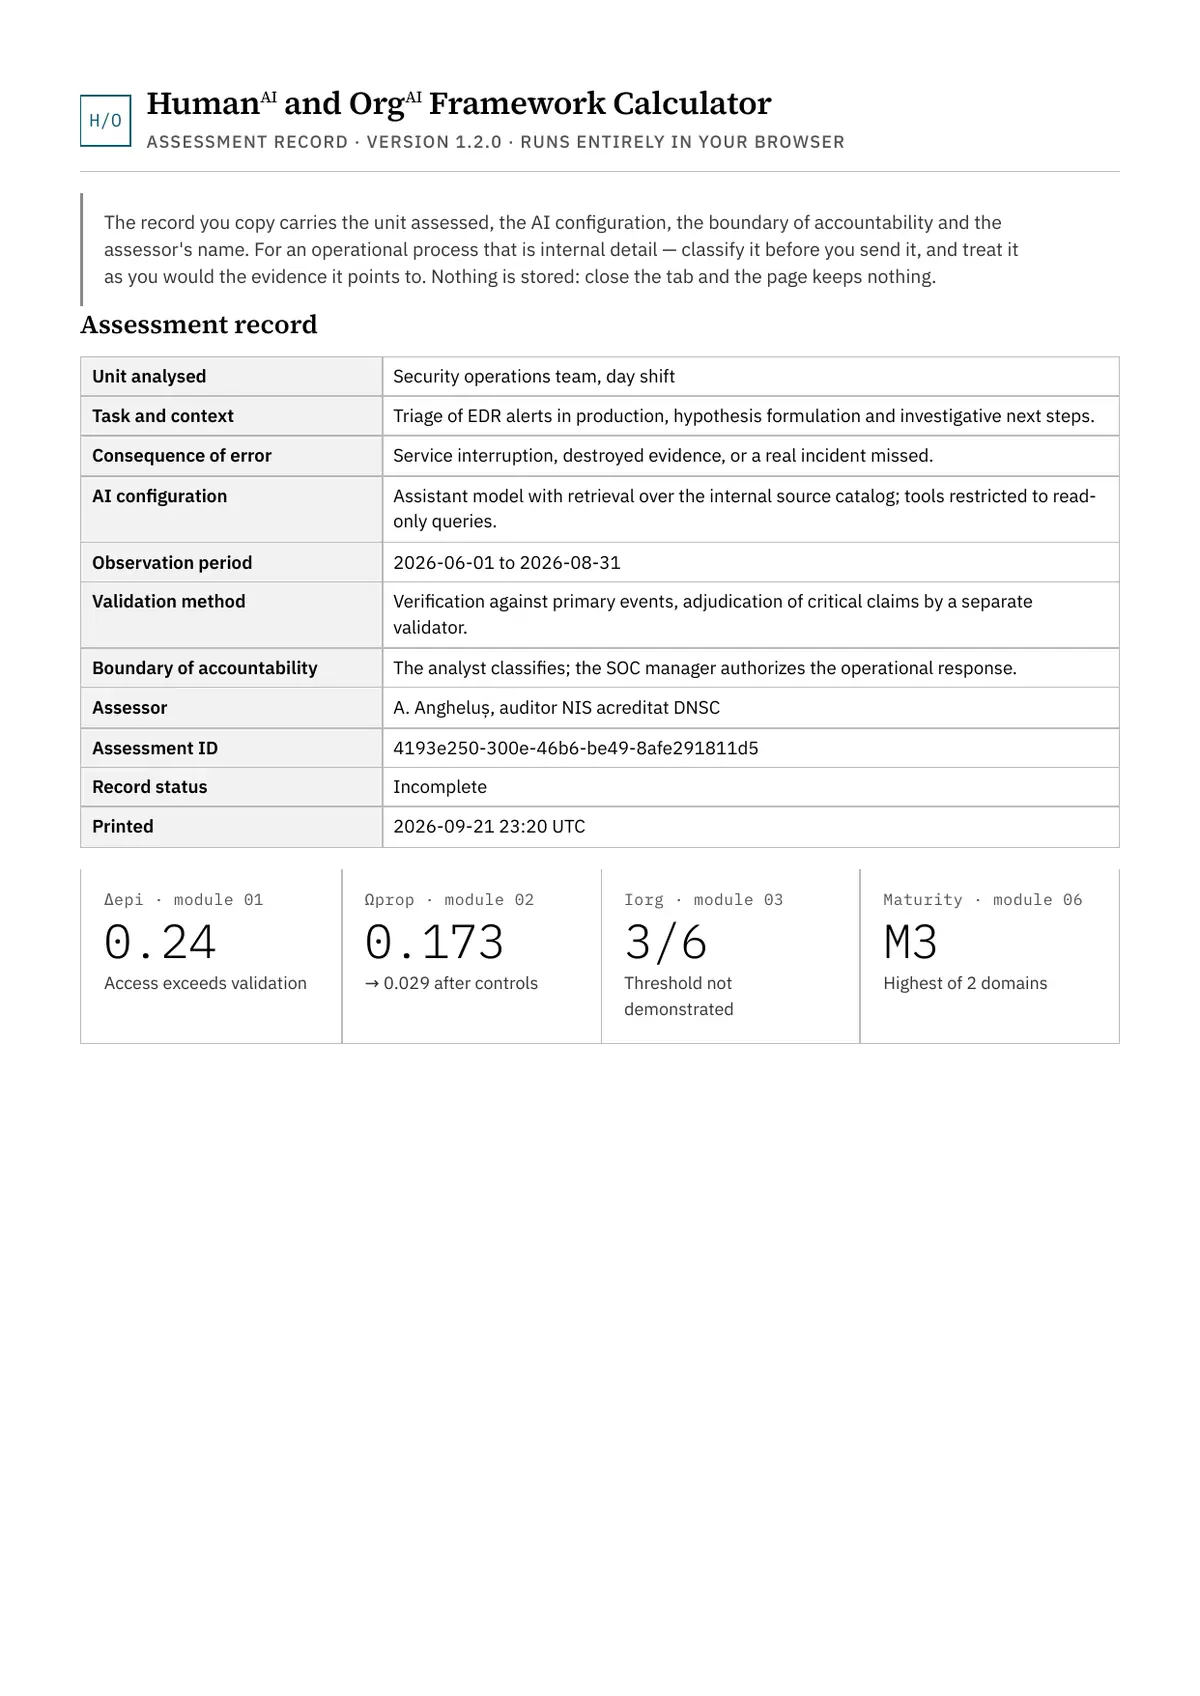
Printing produces the document an auditor or a client receives: a header with the nine fields of the record, the identifier, the state and the date, then each module with its values rendered as text rather than as a form. Roughly 17 pages for a complete record. The JSON record is not printed, so the document is not duplicated.
Properties
| Property | State |
|---|---|
| Installation | None. One HTML file opened in any modern browser |
| Network requests | None. Fonts are embedded; it works on an isolated network |
| Browser persistence | None. No localStorage, no cookies |
| Account, database, analytics | None exist |
| Security policy | Restrictive CSP in the self-hosted variant, with connect-src “none” |
| Themes | Light, dark and the system theme |
| Verification | 29 automated tests that extract the logic from the delivered file |
The last two deserve a look. The instrument follows the system theme with no setting:
And the tests do not hold a copy of the formulas: they extract them from the shipped file, between two markers in the code, so they cannot drift from it. A passing run is a statement about the file in your hand, not about a laboratory version.
Limits
- Results are interpretive. They do not constitute empirical validation, certification, legal advice or a compliance determination.
- The instrument verifies nothing: every value remains a claim by the assessor until it is tied to the evidence it points to.
- The propagation indicator is conceptual; without local calibration it does not estimate real probabilities.
- Thresholds are declared by the user, according to domain and risk. The instrument does not calibrate them.
- The “unknown” state never counts as demonstrated, at any step.
- The instrument cannot be the sole basis of a consequential decision.
The last two remain permanently visible in the interface, not only in the documentation.
Citation and licence
The framework: Angheluș, A. (2026). HumanAI and OrgAI: A Relational Framework for AI-Mediated Human and Organizational Capacity, v1.5. Zenodo. DOI 10.5281/zenodo.22295278
The instrument: Angheluș, A. (2026). HumanAI and OrgAI Framework Calculator, v1.2.0. Zenodo. DOI 10.5281/zenodo.22884721
When you rely on the definitions or on the interpretation of the framework, cite both. The code is licensed under MIT, © 2026 S.C. PRODEFENCE S.R.L.; the conceptual framework and the interpretive text remain under CC BY-ND 4.0, as published in the whitepaper. The PRODEFENCE mark is licensed by neither.
Further reading
The version 1.2.0 announcement, with what changed since 1.0.0, is in the HumanAI and OrgAI Framework Calculator, version 1.2.0. The conceptual framework behind it, with the definitions, the constitutive threshold and the threat model, is explained in HumanAI and OrgAI: what capacity has the organisation built.
Frequently asked questions
What does the guided tour of the calculator cover?
It walks screen by screen through the eight modules of the HumanAI and OrgAI Framework Calculator, plus the diagnostic, with 23 real screenshots: what you see, what you enter and what you get at each step.
What is the difference between exploration mode and assessment mode?
In exploration mode you can move values freely to see how the relationships behave; evidence references are not required, results are marked illustrative and export is disabled. In assessment mode the record becomes mandatory, and export unlocks only when it is complete.
Why are counts entered instead of percentages?
Because “about 90 per cent” cannot be verified, while “126 out of 140” can. Only counts allow the confidence interval that shows whether the gap is demonstrated at the assessed task volume.
What happens if a condition is marked demonstrated without evidence?
It appears as declared, undocumented, the field is highlighted, and it does not count towards the constitutive threshold. The counter shows two numbers, declared and documented, and the difference between them shows the distance between what an organisation believes about itself and what it can show.
What does the instrument produce at the end?
Three things from the same record: the on-screen assessment, a printed record of about 17 pages with the minimum reporting convention in its header, and a JSON record containing the inputs, computed values, evidence references and the limitation statement.
Can an assessment be repeated six months later?
Yes. The JSON record is copied, archived and re-imported, including from earlier versions. If you keep the record identifier, the two assessments form a comparable series instead of two unrelated ones.
